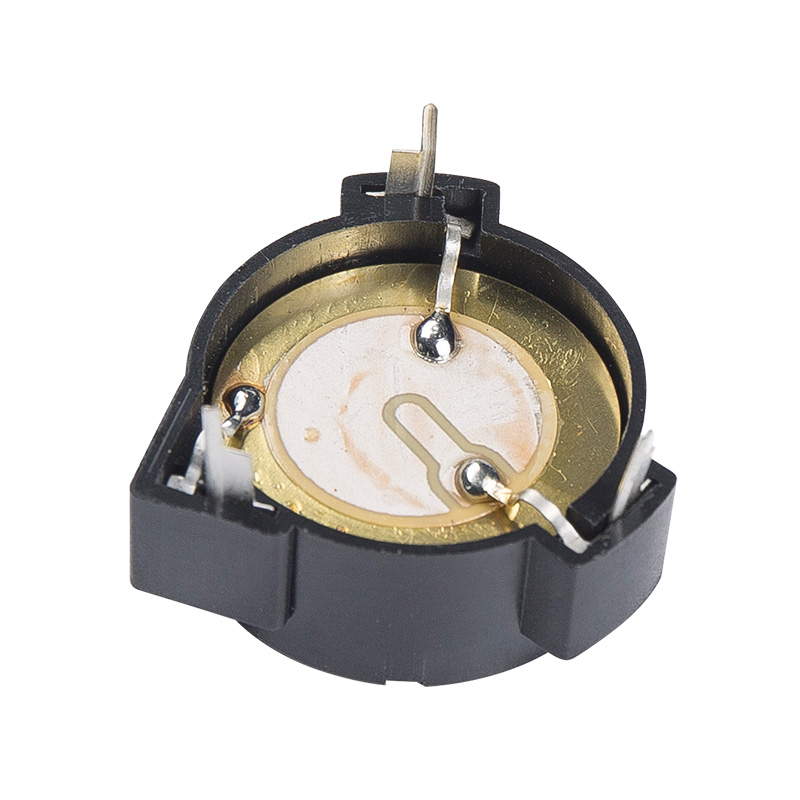
The level of harmonic distortion produced by a 12V loud transducer at various output levels is a critical parameter that affects the sound quality. Harmonic distortion occurs when the transducer introduces additional frequencies that are integer multiples of the original signal frequencies. These distortions can be quantified using Total Harmonic Distortion (THD) measurements.
To assess the harmonic distortion at various output levels, the following steps are typically taken:
Setup for Measurement:
Signal Generator: A signal generator is used to produce a pure sine wave at a specific frequency.
Amplifier: The signal is amplified to the desired voltage level, ensuring it matches the 12V input requirement of the transducer.
Microphone: A precision measurement microphone is placed at a standardized distance from the transducer to capture the output sound.
Spectrum Analyzer: The captured signal is analyzed using a spectrum analyzer to identify and quantify harmonic content.
Measurement Procedure:
Baseline Measurement: Measure the harmonic distortion at a low output level, typically close to the transducer's minimum operating level, to establish a baseline.
Incremental Output Levels: Gradually increase the output level in defined increments (e.g., 1V, 2V, up to 12V) and measure the THD at each level. This can be expressed as a percentage of the total output.
Frequency Variations: Repeat the measurements at various frequencies within the transducer's operating range (e.g., 100 Hz, 1 kHz, 10 kHz) to assess frequencydependent distortion characteristics.

Data Analysis:
THD Calculation: Calculate the THD for each output level by summing the power of the harmonic frequencies (second harmonic, third harmonic, etc.) and comparing it to the power of the fundamental frequency.
Plot Results: Plot the THD percentage against the output levels and frequencies to visualize how distortion varies with output power and frequency.
Example Results
The following hypothetical example illustrates what the measurement results might look like:
At Low Output (1V):
Fundamental Frequency: 1 kHz
Harmonics: 2 kHz, 3 kHz, etc.
THD: 0.5%
At Medium Output (6V):
Fundamental Frequency: 1 kHz
Harmonics: 2 kHz, 3 kHz, etc.
THD: 1.5%
At High Output (12V):
Fundamental Frequency: 1 kHz
Harmonics: 2 kHz, 3 kHz, etc.
THD: 3%
Frequency Dependence:
At 100 Hz, THD might be lower due to better lowfrequency handling.
At 10 kHz, THD might be higher due to limitations in highfrequency response.
Interpretation
Low Output Levels:
Harmonic distortion is generally minimal, producing clean sound reproduction.
Medium Output Levels:
Distortion increases but remains within acceptable limits for many applications.
High Output Levels:
Harmonic distortion can become significant, potentially affecting sound quality, especially in highfidelity audio applications.
Frequency Dependence:
Distortion levels might vary with frequency, indicating specific strengths and weaknesses of the transducer in different parts of its operating range.
By understanding the harmonic distortion characteristics at various output levels and frequencies, engineers can better design and optimize 12V loud transducers for specific applications, ensuring they meet the desired performance standards.


 EN
EN  English
 Deutsch
 中文简体
中文简体
